Only fact I need , you are an a$$hole and that is a fact. Go find another sandboxBring some facts to the table then if you think you are ready to be a big boy. Quit being an emotional Karen just because I called out someone’s bullchit.


Colleges
- AAC
- ACC
- Big 12
- Big East
- Big Ten
- Pac-12
- SEC
- Atlantic 10
- Conference USA
- Independents
- Junior College
- Mountain West
- Sun Belt
- MAC
- More
- Navy
- UAB
- Tulsa
- UTSA
- Charlotte
- Florida Atlantic
- Temple
- Rice
- East Carolina
- USF
- SMU
- North Texas
- Tulane
- Memphis
- Miami
- Louisville
- Virginia
- Syracuse
- Wake Forest
- Duke
- Boston College
- Virginia Tech
- Georgia Tech
- Pittsburgh
- North Carolina
- North Carolina State
- Clemson
- Florida State
- Cincinnati
- BYU
- Houston
- Iowa State
- Kansas State
- Kansas
- Texas
- Oklahoma State
- TCU
- Texas Tech
- Baylor
- Oklahoma
- UCF
- West Virginia
- Wisconsin
- Penn State
- Ohio State
- Purdue
- Minnesota
- Iowa
- Nebraska
- Illinois
- Indiana
- Rutgers
- Michigan State
- Maryland
- Michigan
- Northwestern
- Arizona State
- Oregon State
- UCLA
- Colorado
- Stanford
- Oregon
- Arizona
- California
- Washington
- USC
- Utah
- Washington State
- Texas A&M
- Auburn
- Mississippi State
- Kentucky
- South Carolina
- Arkansas
- Florida
- Missouri
- Ole Miss
- Alabama
- LSU
- Georgia
- Vanderbilt
- Tennessee
- Louisiana Tech
- New Mexico State
- Middle Tennessee
- Western Kentucky
- UTEP
- Florida International University
High School
- West
- Midwest
- Northeast
- Southeast
- Other
- Alaska
- Arizona
- California
- Colorado
- Nevada
- New Mexico
- Northern California
- Oregon
- Southern California Preps
- Washington
- Edgy Tim
- Indiana
- Kansas
- Nebraska
- Iowa
- Michigan
- Minnesota
- Missouri
- Oklahoma Varsity
- Texas Basketball
- Texas
- Wisconsin
- Delaware
- Maryland
- New Jersey Basketball
- New Jersey
- New York City Basketball
- Ohio
- Pennsylvania
- Greater Cincinnati
- Virginia
- West Virginia Preps
ADVERTISEMENT
Install the app
How to install the app on iOS
Follow along with the video below to see how to install our site as a web app on your home screen.
Note: This feature may not be available in some browsers.
You are using an out of date browser. It may not display this or other websites correctly.
You should upgrade or use an alternative browser.
You should upgrade or use an alternative browser.
The Anomalous Voting Patterns in MI, WI, PA, and GA
- Thread starter SDBoiler1
- Start date
🇺🇸Go find your safe space!🇺🇸Only fact I need , you are an a$$hole and that is a fact. Go find another sandbox
Last edited:
It’s a true, what deflection?That is a poor attempt at a deflection. Thanks for posting random meaningless links. Bottomline is red states have the highest crime, poverty and mortality rates in the USA. They take more money than they kick in. They take it from blue states. Sorry but we don’t argue about facts anymore.
oh and congrats on another republican recession.
I will not continue to include links to actual information about your Claims proving your BS over and over again. The Obama economy, crime rates in Democratic cities and now where our a Federal money goes.
It’s a true, what deflection?
I will not continue to include links to actual information about your Claims proving your BS over and over again. The Obama economy, crime rates in Democratic cities and now where our a Federal money goes.
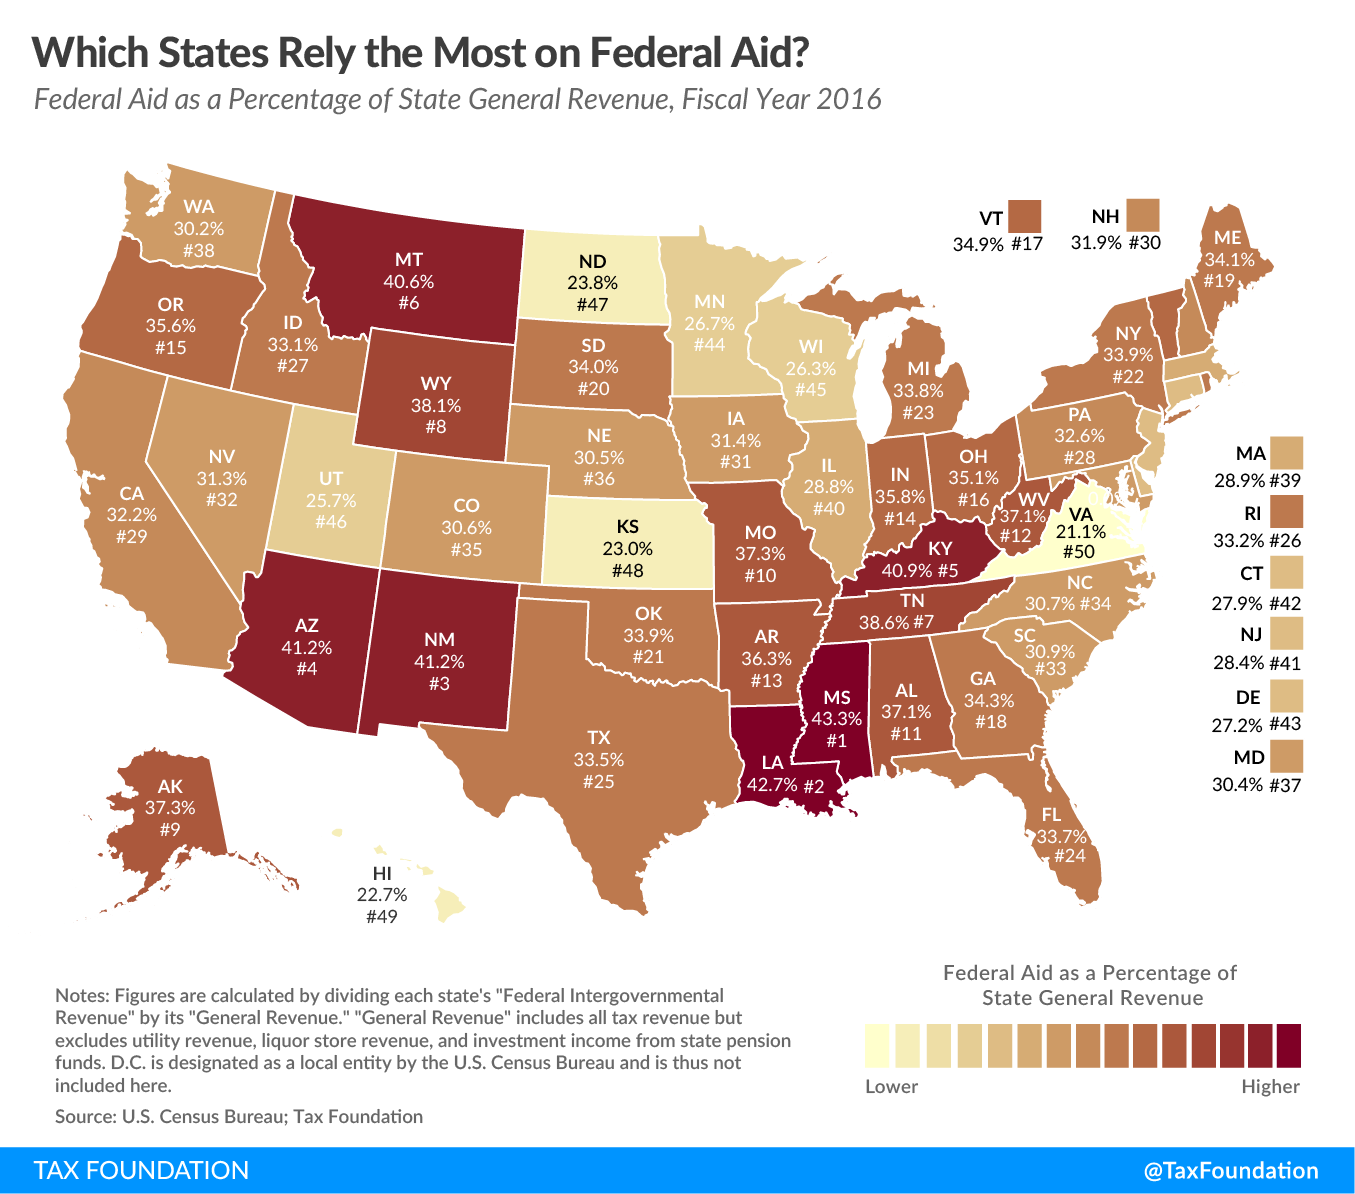
bottom line is red states take more federal dollars than they kick in. They take it from blue states who kick in more than they take.
Red states have the highest crime, poverty and mortality rates in the USA.
Sorry the raw facts don’t align with your false narrative.
Sow me links to prove your claims.bottom line is red states take more federal dollars than they kick in. They take it from blue states who kick in more than they take.
Red states have the highest crime, poverty and mortality rates in the USA.
Sorry the raw facts don’t align with your false narrative.
I have supplied links to prove mine.
you need to learn how to Google. These aren’t hidden facts. Now please go away. I’m tired of spoon feeding you trumpers basic facts. Try to keep up.
Highest crime rate by state

Highest poverty
 taxfoundation.org
Highest crime rate by state
Dangerous states: Which states have the highest rates of violent crime and most murders?
Violent crimes including murder and robbery are down in the U.S. But some states are more dangerous than others, based on 24/7 Wall St.'s ranking.
www.usatoday.com
Highest poverty
Which States Rely the Most on Federal Aid? | Tax Foundation
State taxes aren't the only source of state revenue. How much does your state rely on federal aid? How does state federal aid reliance compare nationally?
taxfoundation.org
Last edited:

BoilerJS has an incredibly hard time understanding charts, graphs, numbers, etc.you need to learn how to Google. These aren’t hidden facts. Now please go away. I’m tired of spoon feeding you trumpers basic facts. Try to keep up.
Highest crime rate by state
Dangerous states: Which states have the highest rates of violent crime and most murders?
Violent crimes including murder and robbery are down in the U.S. But some states are more dangerous than others, based on 24/7 Wall St.'s ranking.www.usatoday.com
Highest poverty
Which States Rely the Most on Federal Aid? | Tax Foundation
State taxes aren't the only source of state revenue. How much does your state rely on federal aid? How does state federal aid reliance compare nationally?
Ha did you even look at the links? There wasn’t one graph or chart in the links.BoilerJS has an incredibly hard time understanding charts, graphs, numbers, etc.
Just subjective articles and displays.
I linked actual charts and graphs to federal web sites.
I see you couldn’t find even a propaganda sight to link with statistics showing how the great Obama economy was doing better than the current Trump recession.
Why because the CURRENT economy is doing better than at ANY TIME during the Obama Biden years.
Last edited:
Yeah, you’re pretty ignorant when it comes to economic numbers.Ha did you even look at the links? There wasn’t one graph or chart in the links.
Just subjective articles and displays.
I linked actual charts and graphs to federal web sites.
I see you couldn’t find even a propaganda sight to link with statistics showing how the great Obama economy was doing better than the current Trump recession.
Why because the CURRENT economy is doing better than at ANY TIME during the Obama Biden years.
Stock market does not equal economy.Ha did you even look at the links? There wasn’t one graph or chart in the links.
Just subjective articles and displays.
I linked actual charts and graphs to federal web sites.
I see you couldn’t find even a propaganda sight to link with statistics showing how the great Obama economy was doing better than the current Trump recession.
Why because the CURRENT economy is doing better than at ANY TIME during the Obama Biden years.
GDP graphs, economic numbers, employment numbers.Stock market does not equal economy.
Is this so hard for you guys to understand?
But since you brought it up the Stock Market has also done quite well.
So you think employment numbers are awesome? I beg to differ.GDP graphs, economic numbers, employment numbers.
Is this so hard for you guys to understand?
But since you brought it up the Stock Market has also done quite well.
So you think employment numbers are awesome? I beg to differ.
Yes, the economy has really stalled due to the Virus however, look at the job numbers chart at the link below.
Employed January 2016-152 million Highest employment rate during the OBAMA Adm.
Employed February 2020-159 million.
March shows a 3 million drop, if April drops the projected 5 million we are still close to the 2016 employment levels.
It shows just how robust our economy has been the last few years.
Employment Graph
http://www.dlt.ri.gov/lmi/laus/us/usadj.htm
Not as good as they were a year ago but better than at anytime under Obama.
Similar threads
ADVERTISEMENT
ADVERTISEMENT